“Sum of UnitPriceDiscount” Showed $8.4 — A Number That Means Nothing
Power BI, DAX, Data Modeling
UnitPriceDiscount on the SalesLT SalesOrderDetail table is a rate — a decimal like 0.05 or 0.10, a percentage off a line item. I dragged it straight into a table to eyeball it, the way you do, and didn't build a measure first.
Power BI picked an aggregation for me
With no explicit measure, Power BI applied its default implicit aggregation: Sum. The visual labelled itself “Sum of UnitPriceDiscount,” and the total row showed $8.4 — formatted as currency, sitting at the bottom of the table looking exactly like a real total.
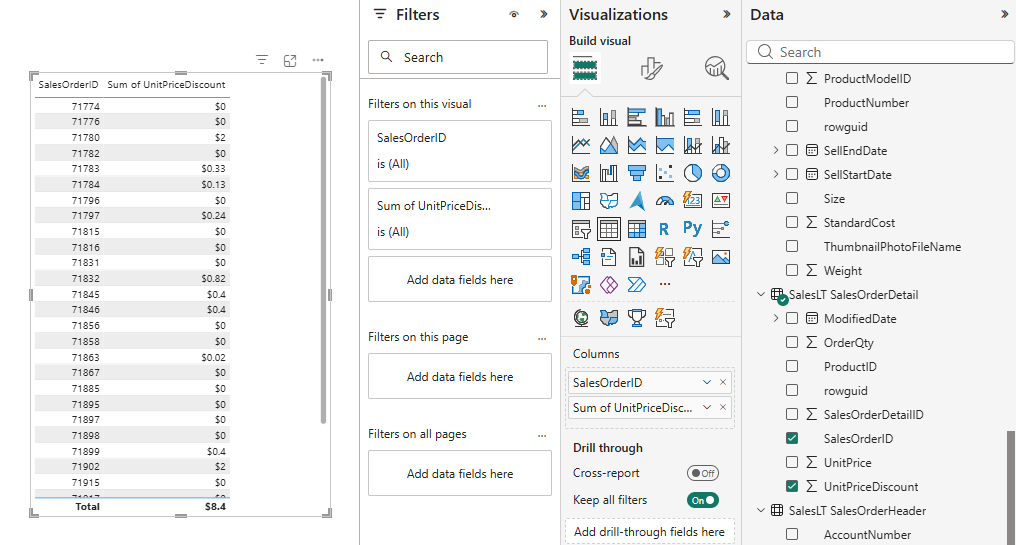
But summing a rate across rows produces a number with no meaning. $8.4 isn't a discount amount, it isn't a percentage, it isn't anything a stakeholder could act on. It's what you get when you add percentages together, which isn't a valid operation for this data. Nothing in the UI flagged it, because Sum is the default for anything numeric.
One explicit measure, with the right aggregation
Avg Discount =
AVERAGE ( 'SalesLT SalesOrderDetail'[UnitPriceDiscount] )
Then swap that measure into the visual in place of the raw column — Average, not Sum, because that's the aggregation a rate actually deserves.
After the fix
The total became $0.0155 — an actual average discount rate across all orders. Individual rows changed too, from arbitrary summed values to real per-order averages. Row 71845 went from a flat $0.4 sum to a correctly averaged $0.0129.
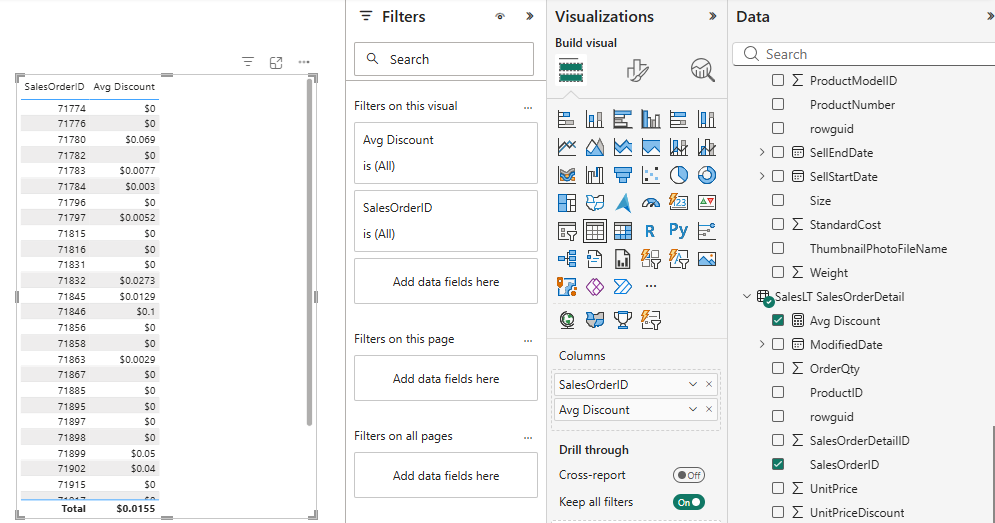
Power BI will sum anything numeric — rates, percentages, even IDs — unless you tell it otherwise. Before trusting an implicit total, ask what aggregation the column actually deserves.
What I take from this
- An implicit total can be formatted like currency and still be meaningless
- Rates and percentages need Average (or a weighted calculation), never a plain Sum
- If a field isn't meant to be summed, build the measure explicitly rather than leaning on the default