The Total Row Said $111,270.85. The Real Answer Was $146,626.18.
Power BI, DAX
This one isn't a performance question. It's a correctness one, and it's easy to ship without noticing.
The total row didn't add up what was on screen
I built a simple table on the NYC taxi data: PickupDate down the rows, a Max Fare measure, one row per day showing that day's single highest fare. Then I turned on the Total row, expecting it to add up the values above it.
It didn't. The Total showed the single highest fare across the entire 10.9-million-row table, recalculated with no date context at all — not the sum of the daily maximums.
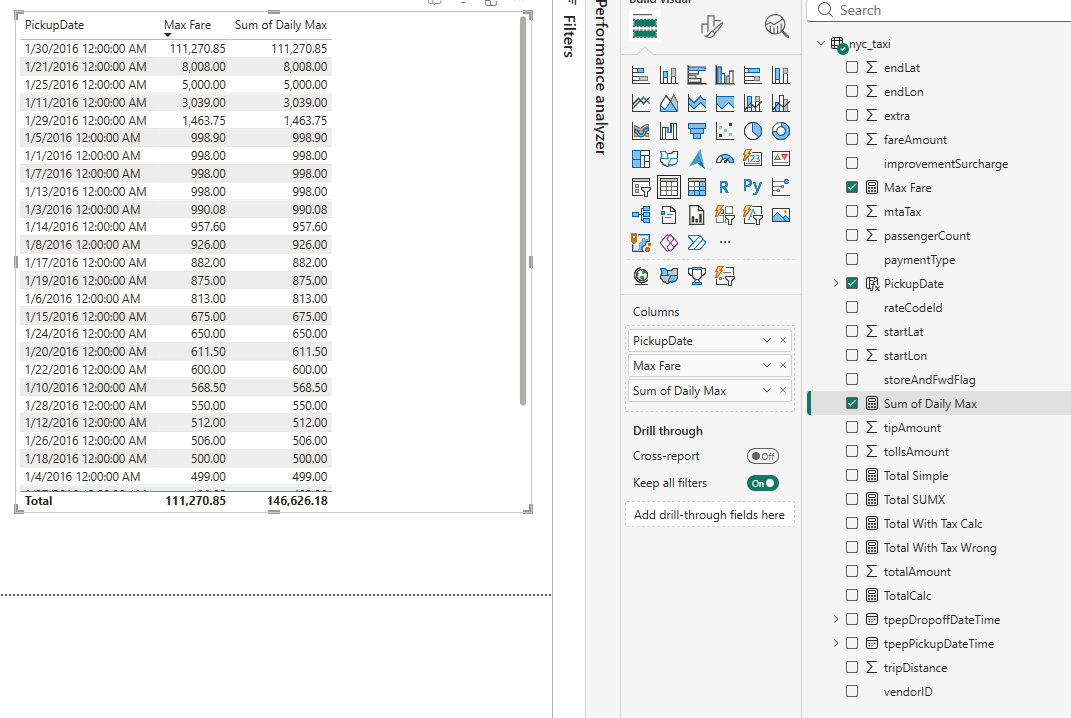
This is standard behaviour: a measure's Total row doesn't sum the displayed values. It re-evaluates the measure in the filter context of the Total row itself. For MAX(), that context means “ignore the per-day breakdown and find the one true maximum.”
Forcing per-date evaluation, then summing
Sum of Daily Max =
SUMX ( VALUES ( nyc_taxi[PickupDate] ), [Max Fare] )
This tells the engine: for each distinct date, evaluate Max Fare in that date's context, then sum those individual results. That's the operation a plain Total row can't do on its own.
After the fix
The Total came to $146,626.18 — genuinely the sum of every visible daily max, and you can verify it by adding the column by hand. The original $111,270.85 is now visibly, provably wrong for what it claims to represent.
A measure's Total row is a fresh recalculation in a different filter context, not “the sum of what you see.” For any aggregation-of-an-aggregation, SUMX(VALUES(...), [Measure]) is required, not optional.
What I take from this
- For anything other than a plain SUM, the Total row can silently disagree with the rows above it
- "Sum of a per-group value" — daily max, per-customer average — always needs SUMX(VALUES(...), [Measure])
- This is about getting a correct number, not a fast one